sisti provides real-time PCR data sets by Sisti et al. (2010) in tidy format as one single table (also named) sisti.
The primary dataset comprises a ten-fold dilution series spanning copy numbers from 3.14 × 10⁷ to 3.14 × 10², with twelve replicates per concentration. These samples are based on a pGEM-T Promega plasmid containing a 104 bp fragment of the mitochondrial gene NADH dehydrogenase 1 (MT-ND1), amplified using the ND1/ND2 primer pair. The remaining three datasets contain qPCR results in the presence of specific PCR inhibitors: tannic acid, immunoglobulin G (IgG), and quercetin, respectively, to assess their effects on the amplification process.
Each original data set can be obtained by filtering sisti by plate (see below).
Installation
install.packages("sisti")Data
Each sample group is defined by the inhibitor (“none”, “tannic acid”, “IgG” or “quercitin”), respective inhibitor concentration, and initial amplicon copy number.
library(ggplot2)
library(dplyr, warn.conflicts = FALSE)
library(sisti)

sisti |>
  dplyr::distinct(plate, inhibitor, inhibitor_conc, copies, dilution) |>
  print(n = Inf)
#> # A tibble: 32 × 5
#>    plate       inhibitor   inhibitor_conc   copies dilution
#>    <fct>       <fct>                <dbl>    <int>    <int>
#>  1 calibration none              0        31400000        1
#>  2 calibration none              0         3140000       10
#>  3 calibration none              0          314000      100
#>  4 calibration none              0           31400     1000
#>  5 calibration none              0            3140    10000
#>  6 calibration none              0             314   100000
#>  7 tannic acid tannic acid       0.1         31400     1000
#>  8 tannic acid tannic acid       0.05        31400     1000
#>  9 tannic acid tannic acid       0.025       31400     1000
#> 10 tannic acid tannic acid       0.0125      31400     1000
#> 11 tannic acid tannic acid       0.00625     31400     1000
#> 12 tannic acid tannic acid       0.00312     31400     1000
#> 13 tannic acid tannic acid       0.00156     31400     1000
#> 14 tannic acid tannic acid       0.000781    31400     1000
#> 15 tannic acid tannic acid       0.000391    31400     1000
#> 16 IgG         IgG               2         3140000       10
#> 17 IgG         IgG               1         3140000       10
#> 18 IgG         IgG               0.5       3140000       10
#> 19 IgG         IgG               0.25      3140000       10
#> 20 IgG         IgG               0.125     3140000       10
#> 21 IgG         IgG               0.0625    3140000       10
#> 22 IgG         IgG               0.0312    3140000       10
#> 23 IgG         IgG               0.0156    3140000       10
#> 24 IgG         IgG               0.00781   3140000       10
#> 25 quercitin   quercitin         0.04        31400     1000
#> 26 quercitin   quercitin         0.02        31400     1000
#> 27 quercitin   quercitin         0.01        31400     1000
#> 28 quercitin   quercitin         0.005       31400     1000
#> 29 quercitin   quercitin         0.0025      31400     1000
#> 30 quercitin   quercitin         0.00125     31400     1000
#> 31 quercitin   quercitin         0.000625    31400     1000
#> 32 quercitin   quercitin         0.000312    31400     1000
Here is the number of replicates per group:
sisti |>
  dplyr::distinct(plate, inhibitor, inhibitor_conc, copies, dilution, replicate) |>
  dplyr::count(plate, inhibitor, inhibitor_conc, copies, dilution) |>
  print(n = Inf)
#> # A tibble: 32 × 6
#>    plate       inhibitor   inhibitor_conc   copies dilution     n
#>    <fct>       <fct>                <dbl>    <int>    <int> <int>
#>  1 calibration none              0             314   100000    12
#>  2 calibration none              0            3140    10000    12
#>  3 calibration none              0           31400     1000    12
#>  4 calibration none              0          314000      100    12
#>  5 calibration none              0         3140000       10    12
#>  6 calibration none              0        31400000        1    12
#>  7 IgG         IgG               0.00781   3140000       10     6
#>  8 IgG         IgG               0.0156    3140000       10     6
#>  9 IgG         IgG               0.0312    3140000       10     6
#> 10 IgG         IgG               0.0625    3140000       10     6
#> 11 IgG         IgG               0.125     3140000       10     6
#> 12 IgG         IgG               0.25      3140000       10     6
#> 13 IgG         IgG               0.5       3140000       10     6
#> 14 IgG         IgG               1         3140000       10     6
#> 15 IgG         IgG               2         3140000       10     6
#> 16 quercitin   quercitin         0.000312    31400     1000     6
#> 17 quercitin   quercitin         0.000625    31400     1000     6
#> 18 quercitin   quercitin         0.00125     31400     1000     6
#> 19 quercitin   quercitin         0.0025      31400     1000     6
#> 20 quercitin   quercitin         0.005       31400     1000     6
#> 21 quercitin   quercitin         0.01        31400     1000     6
#> 22 quercitin   quercitin         0.02        31400     1000     6
#> 23 quercitin   quercitin         0.04        31400     1000     6
#> 24 tannic acid tannic acid       0.000391    31400     1000     6
#> 25 tannic acid tannic acid       0.000781    31400     1000     6
#> 26 tannic acid tannic acid       0.00156     31400     1000     6
#> 27 tannic acid tannic acid       0.00312     31400     1000     6
#> 28 tannic acid tannic acid       0.00625     31400     1000     6
#> 29 tannic acid tannic acid       0.0125      31400     1000     6
#> 30 tannic acid tannic acid       0.025       31400     1000     6
#> 31 tannic acid tannic acid       0.05        31400     1000     6
#> 32 tannic acid tannic acid       0.1         31400     1000     6
Standard dilution series
Most concentrated set of samples in the dilution series have 3.14 × 10⁷ copies of the NADH dehydrogenase 1 (MT-ND1) amplicon. Following samples in the series are ten-fold dilutions.
sisti |>
  dplyr::filter(plate == "calibration") |>
  ggplot(aes(
    x = cycle,
    y = fluor,
    group = interaction(replicate, copies),
    col = as.factor(copies)
  )) +
  geom_line(linewidth = 0.1) +
  geom_point(size = 0.05) +
  labs(color = "Copy number")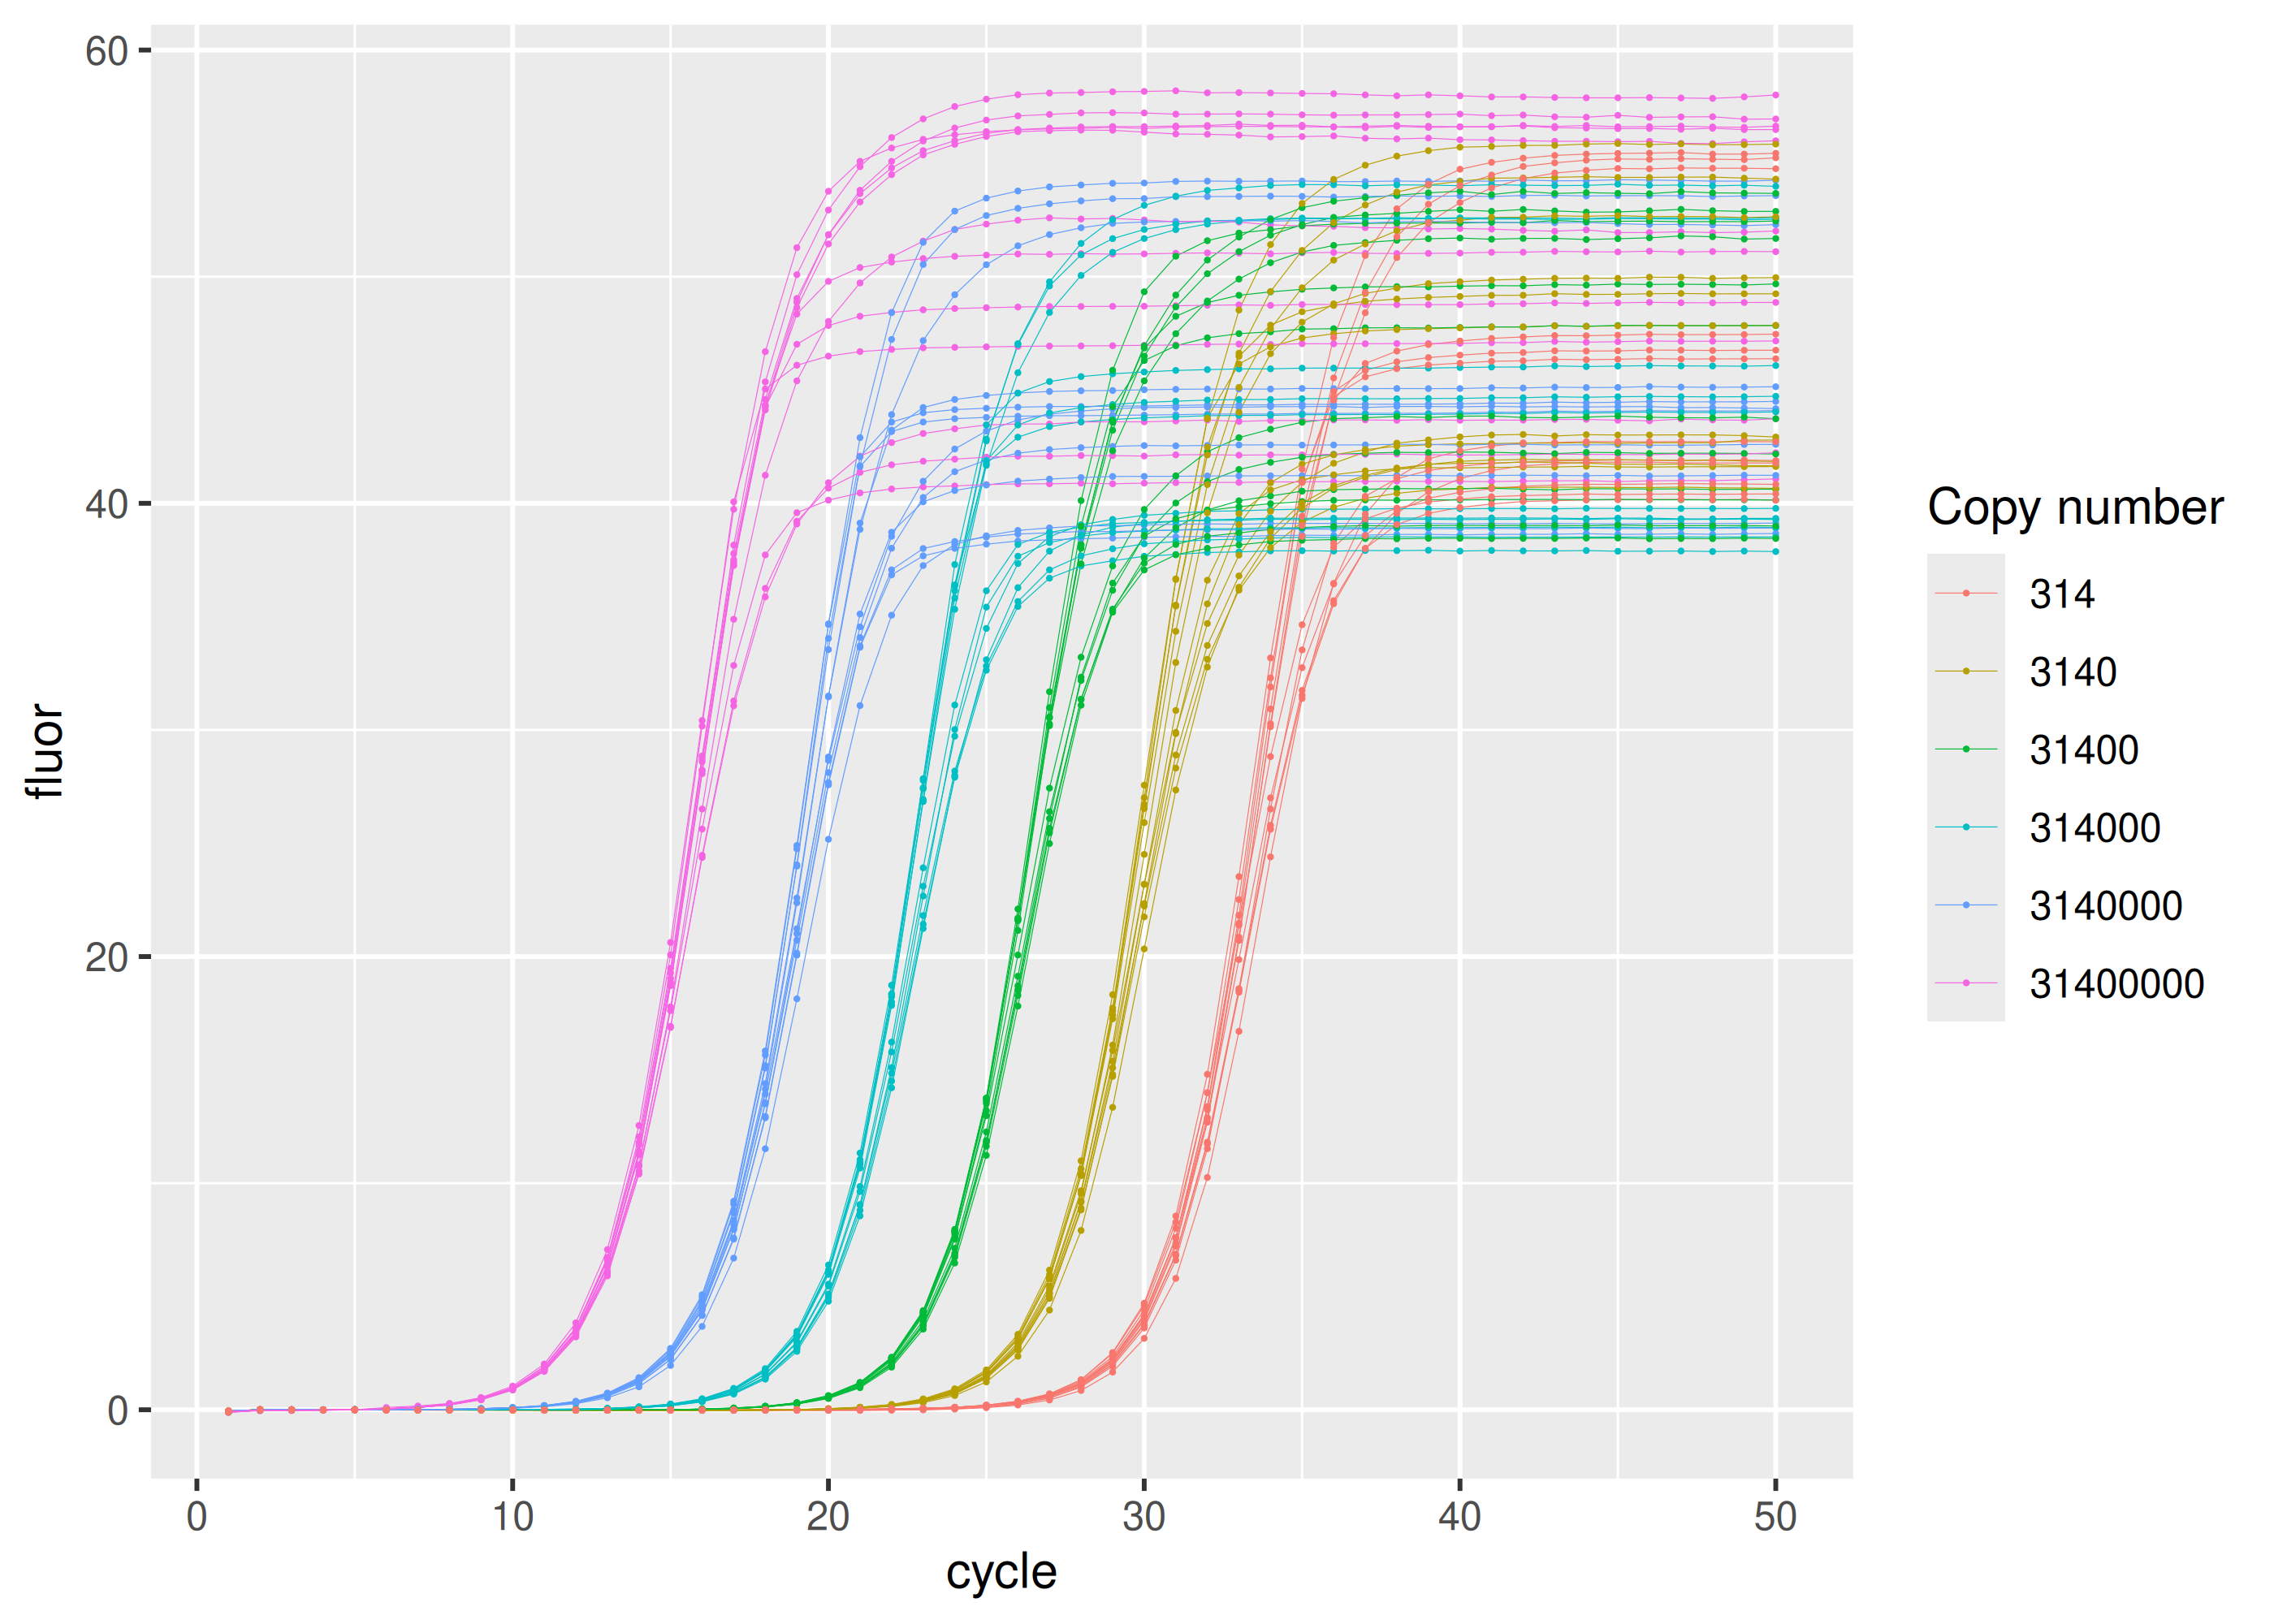
Inhibition by tannic acid
sisti |>
  dplyr::filter(plate == "tannic acid") |>
  ggplot(aes(
    x = cycle,
    y = fluor,
    group = interaction(replicate, inhibitor_conc),
    col = as.factor(inhibitor_conc)
  )) +
  geom_line(linewidth = 0.1) +
  geom_point(size = 0.05) +
  labs(color = "Tannic acid conc (mg/mL)")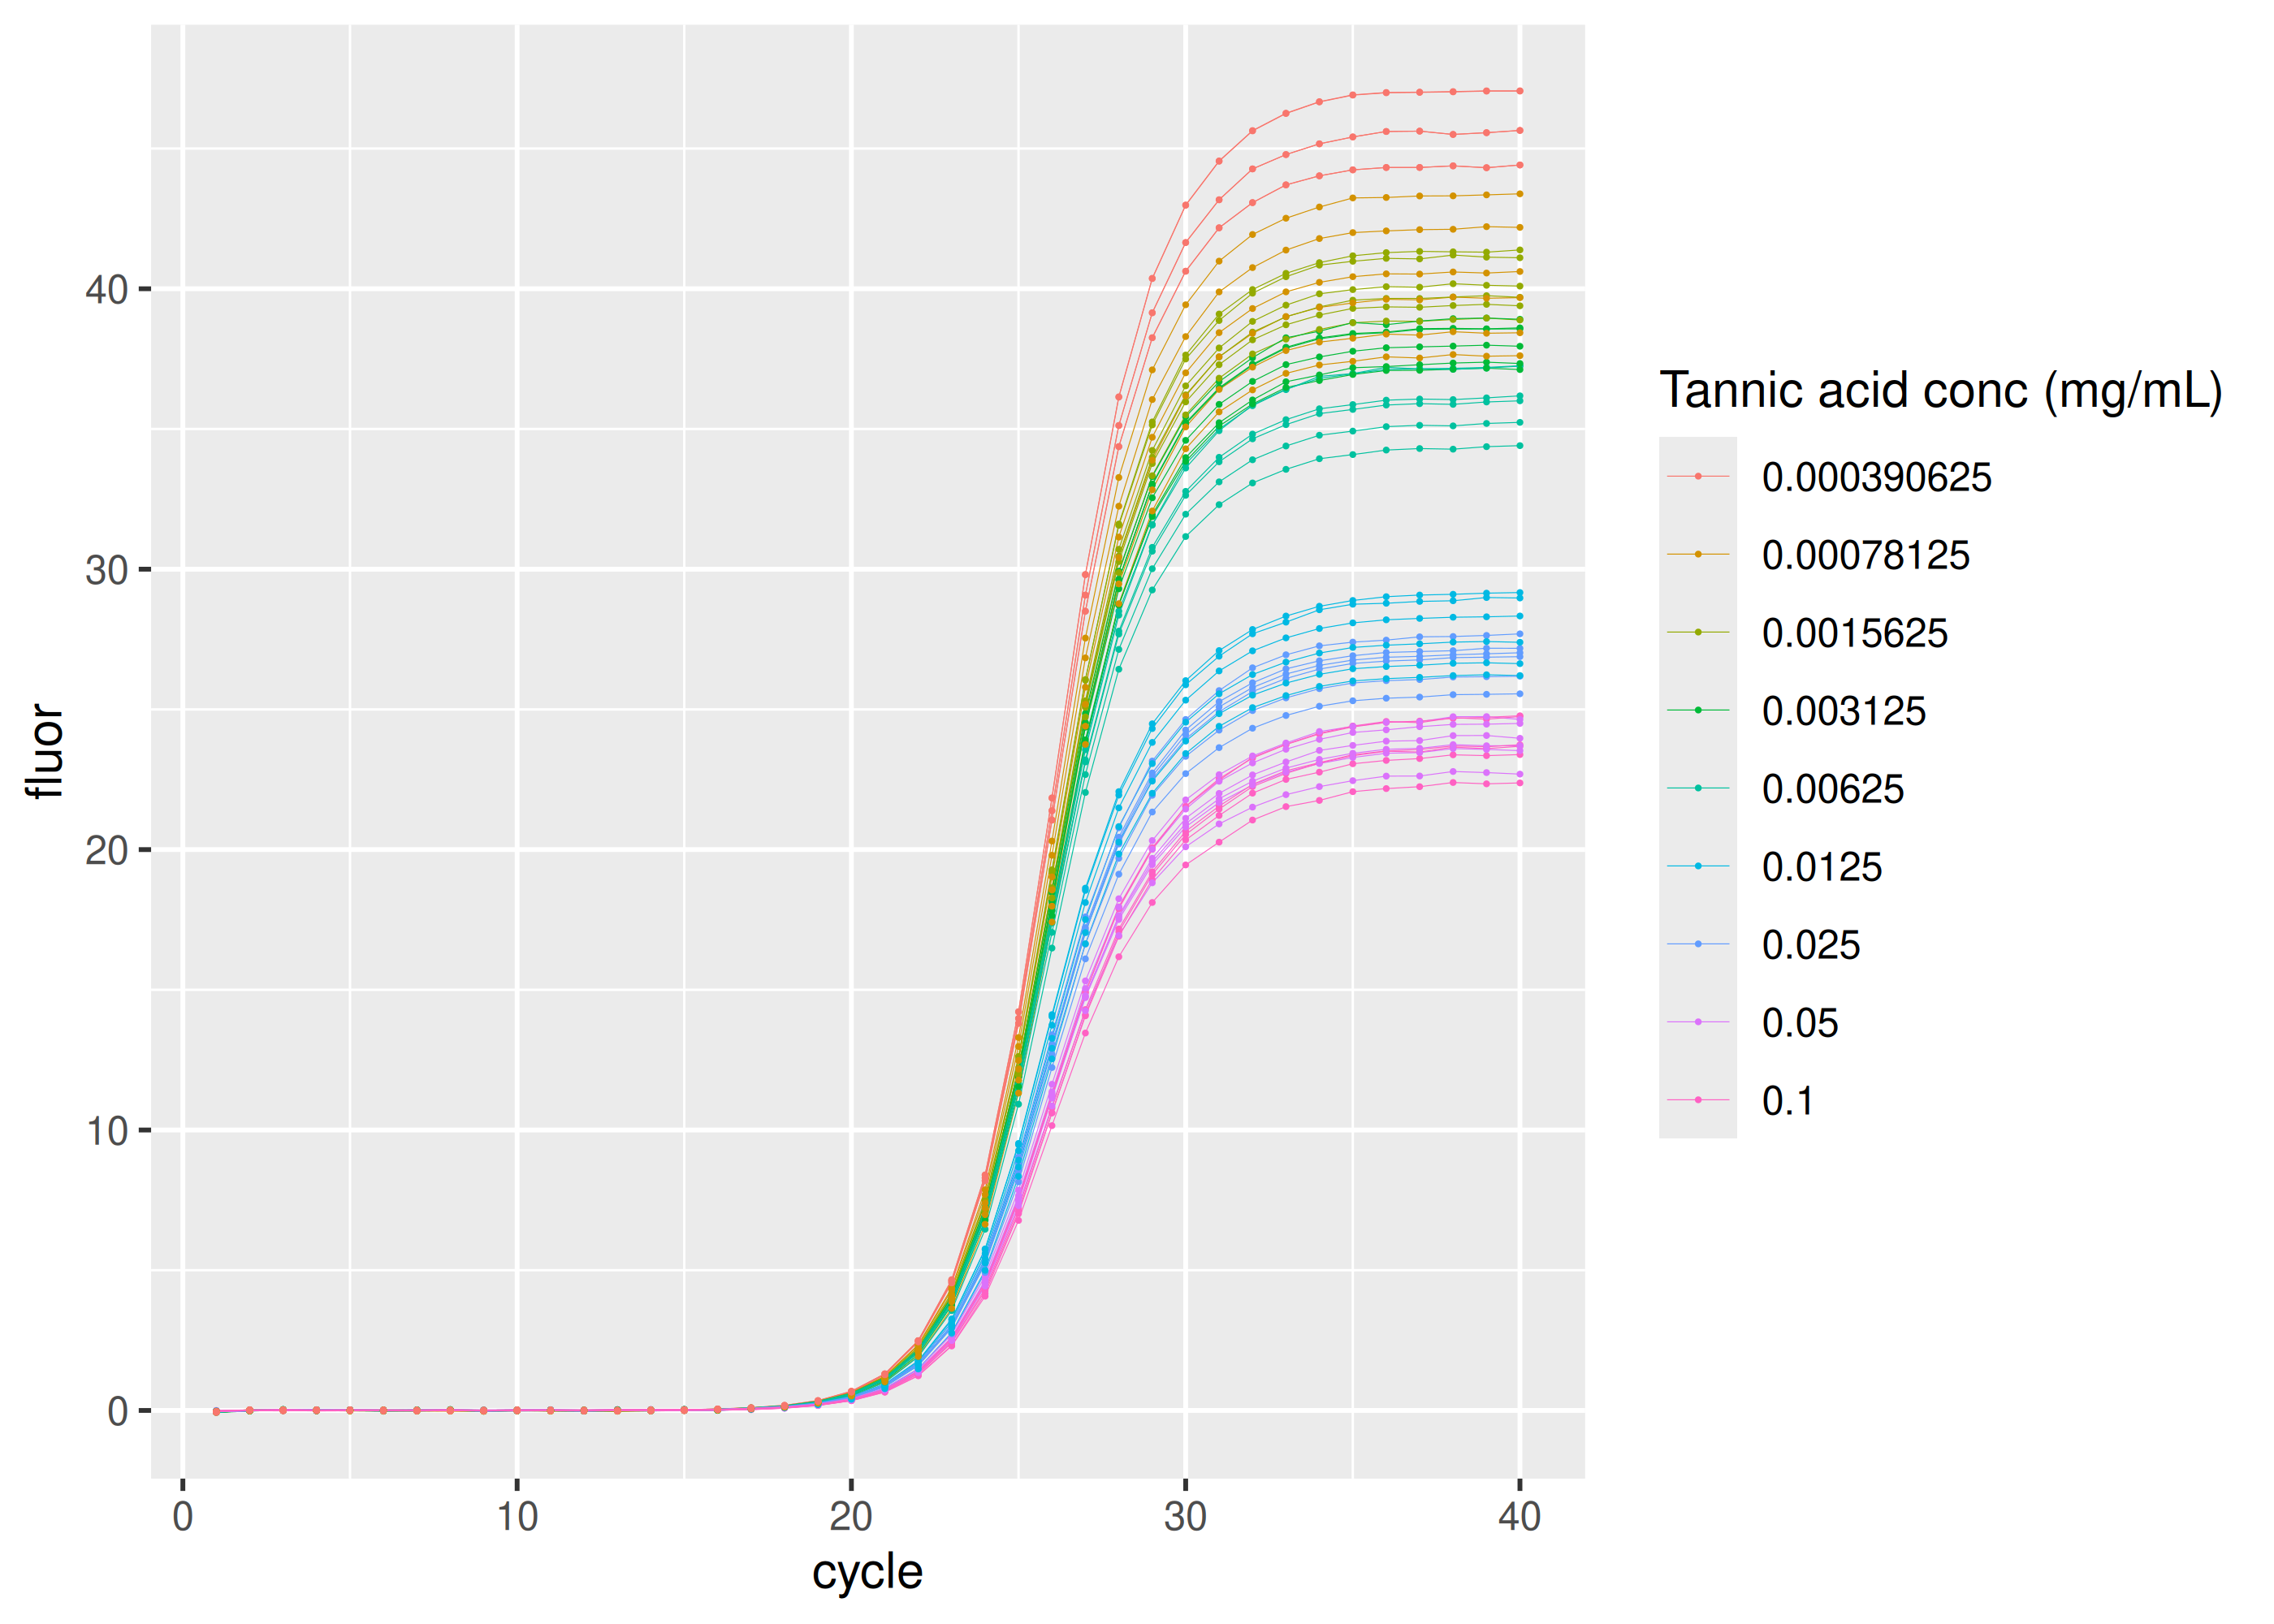
Inhibition by immunoglobulin G (IgG)
sisti |>
  dplyr::filter(plate == "IgG") |>
  ggplot(aes(
    x = cycle,
    y = fluor,
    group = interaction(replicate, inhibitor_conc),
    col = as.factor(inhibitor_conc)
  )) +
  geom_line(linewidth = 0.1) +
  geom_point(size = 0.05) +
  labs(color = "IgG conc (mg/mL)")
Inhibition by quercitin
sisti |>
  dplyr::filter(plate == "quercitin") |>
  ggplot(aes(
    x = cycle,
    y = fluor,
    group = interaction(replicate, inhibitor_conc),
    col = as.factor(inhibitor_conc)
  )) +
  geom_line(linewidth = 0.1) +
  geom_point(size = 0.05) +
  labs(color = "Quercitin conc (mg/mL)")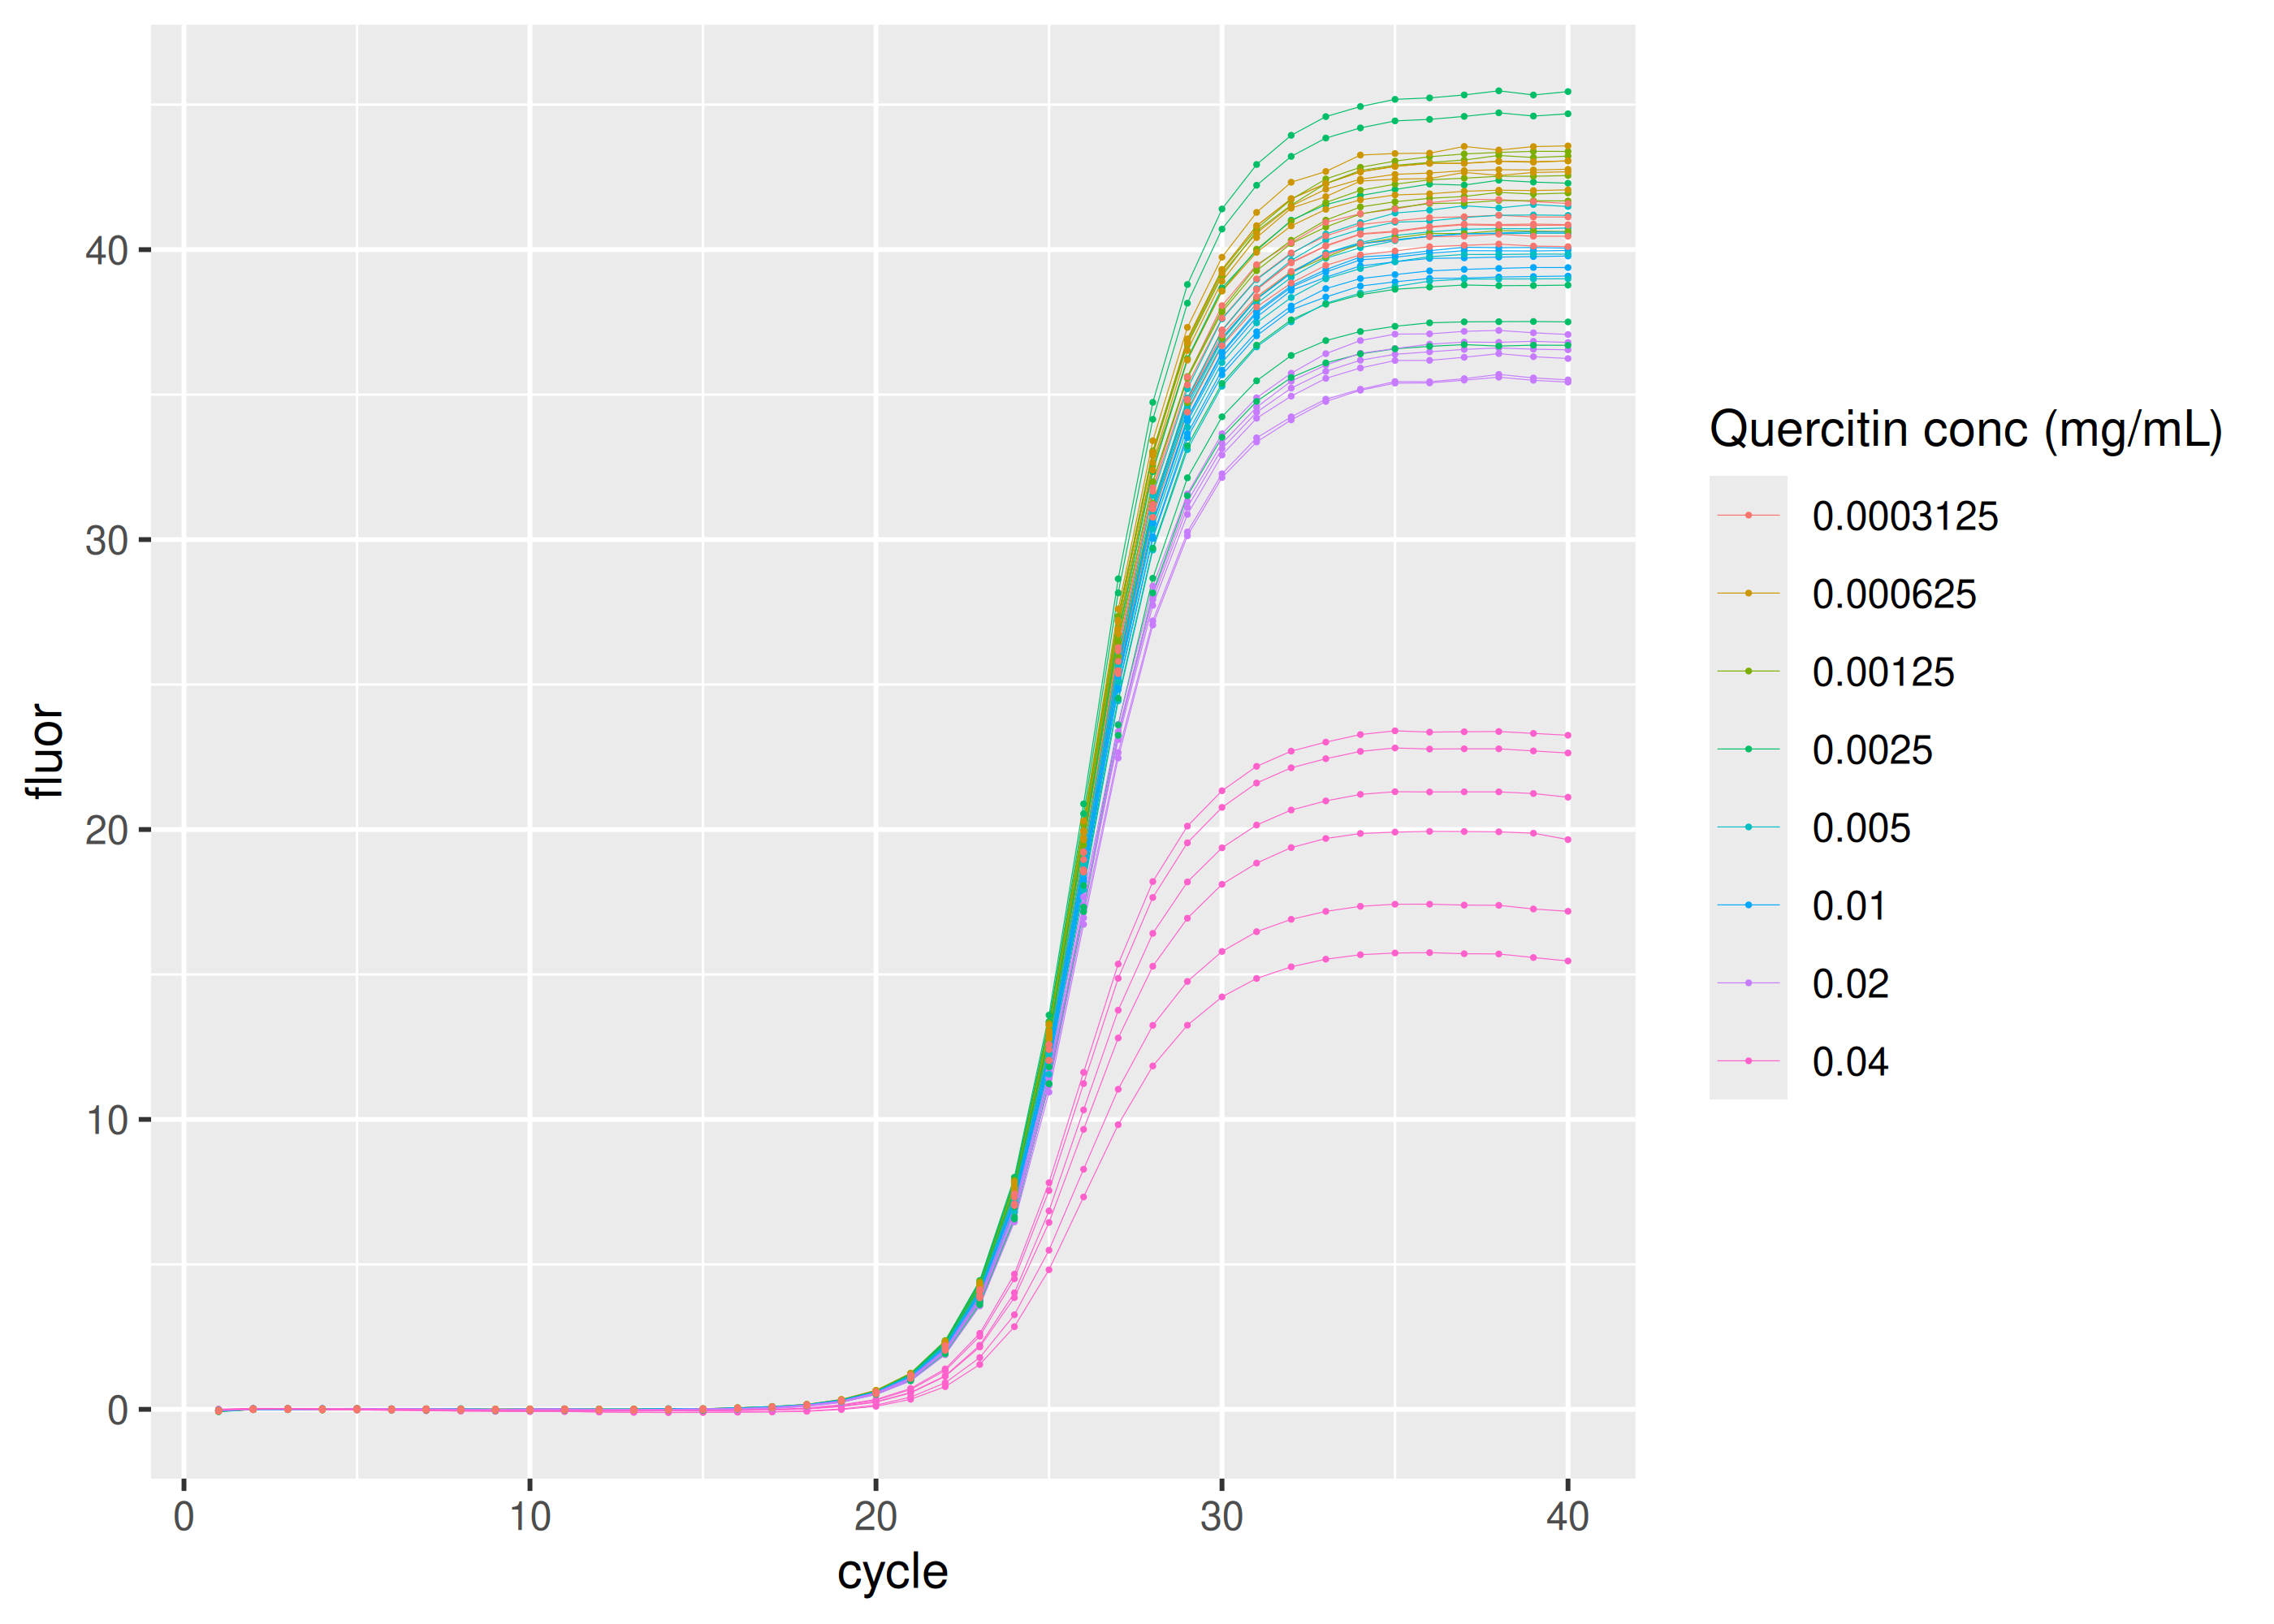
Code of Conduct
Please note that the sisti project is released with a Contributor Code of Conduct. By contributing to this project, you agree to abide by its terms.
References
Davide Sisti, Michele Guescini, Marco BL Rocchi, Pasquale Tibollo, Mario D’Atri and Vilberto Stocchi. Shape based kinetic outlier detection in real-time PCR. BMC Bioinformatics 11:186 (2010). doi: 10.1186/1471-2105-11-186.