batsch provides real-time PCR data sets by Batsch et al. (2008) in tidy format. There are five data sets bundled with this package, one for each PCR target:
-
SLC6A14rfor rat SLC6A14 -
SLC22A13hfor human SLC22A13 -
EMTpfor pig EMT -
ETTchfor chicken ETT -
GAPDHhfor human GAPDH
Each data set comprises a five-point, four-fold dilution series. For each concentration there are three replicates. Each amplification curve is 45 cycles long.
Installation
Install batsch from CRAN:
# Install from CRAN
install.packages("batsch")
You can instead install the development version of batsch from GitHub:
# install.packages("remotes")
remotes::install_github("ramiromagno/batsch")
Usage
Rat SLC6A14
library(batsch)

SLC6A14r |>
  ggplot(mapping = aes(
    x = cycle,
    y = fluor,
    group = interaction(dilution, replicate),
    col = as.factor(dilution)
  )) +
  geom_line(linewidth = 0.5) +
  labs(y = "Raw fluorescence", colour = "Dilution factor", title = "Rat SLC6A14") +
  guides(color = guide_legend(override.aes = list(size = 0.5)))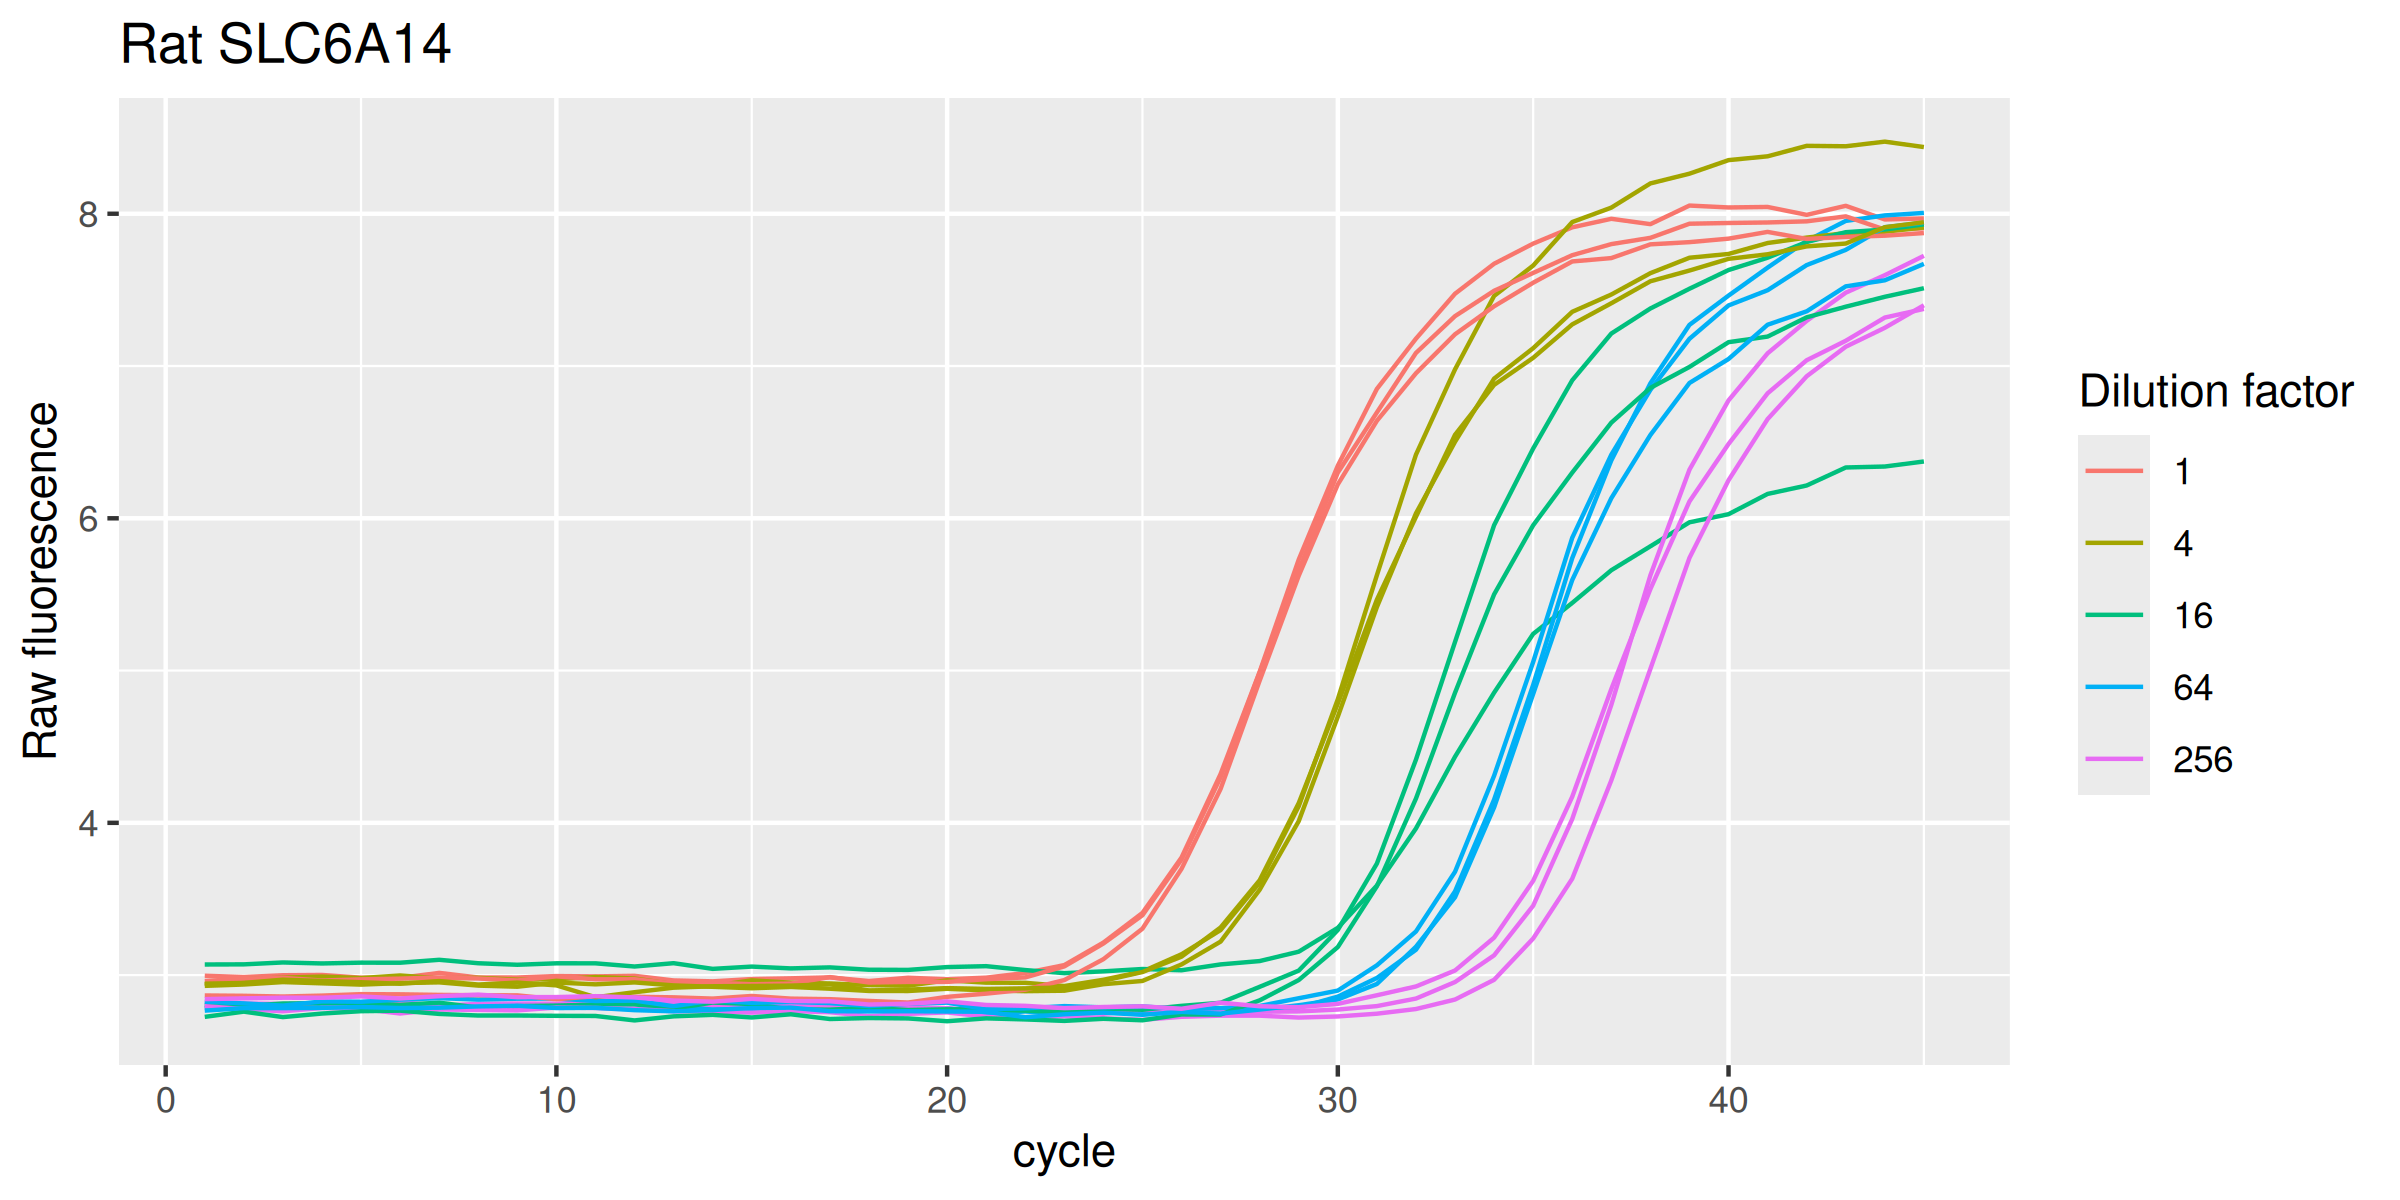
Human SLC22A13
SLC22A13h |>
  ggplot(mapping = aes(
    x = cycle,
    y = fluor,
    group = interaction(dilution, replicate),
    col = as.factor(dilution)
  )) +
  geom_line(linewidth = 0.5) +
  labs(y = "Raw fluorescence", colour = "Dilution factor", title = "Human SLC22A13") +
  guides(color = guide_legend(override.aes = list(size = 0.5)))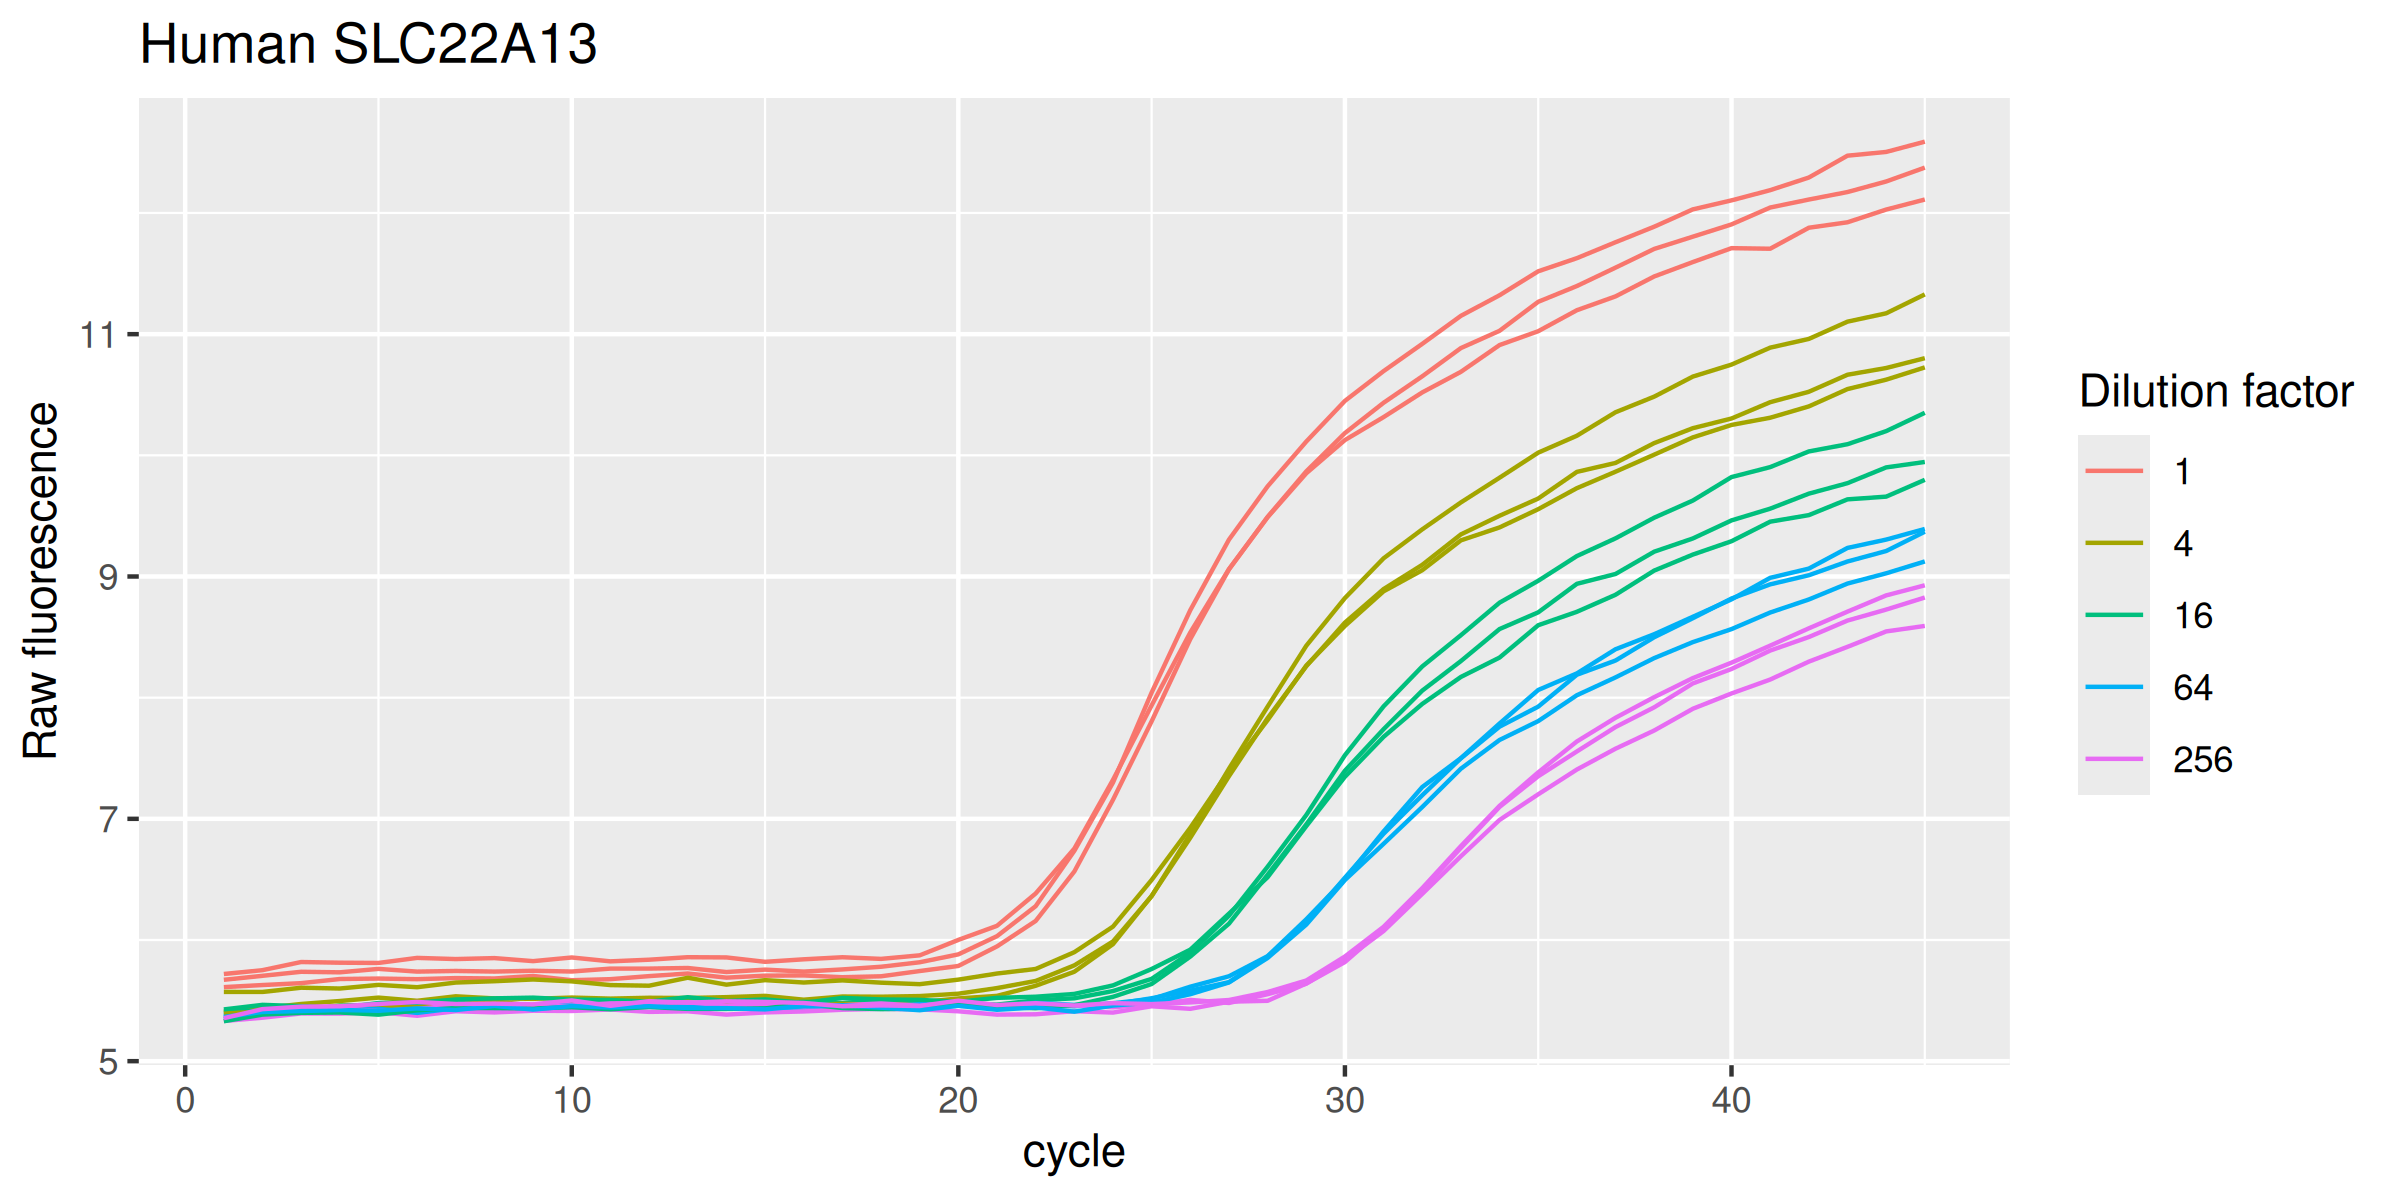
Pig EMT
EMTp |>
  ggplot(mapping = aes(
    x = cycle,
    y = fluor,
    group = interaction(dilution, replicate),
    col = as.factor(dilution)
  )) +
  geom_line(linewidth = 0.5) +
  labs(y = "Raw fluorescence", colour = "Dilution factor", title = "Pig EMT") +
  guides(color = guide_legend(override.aes = list(size = 0.5)))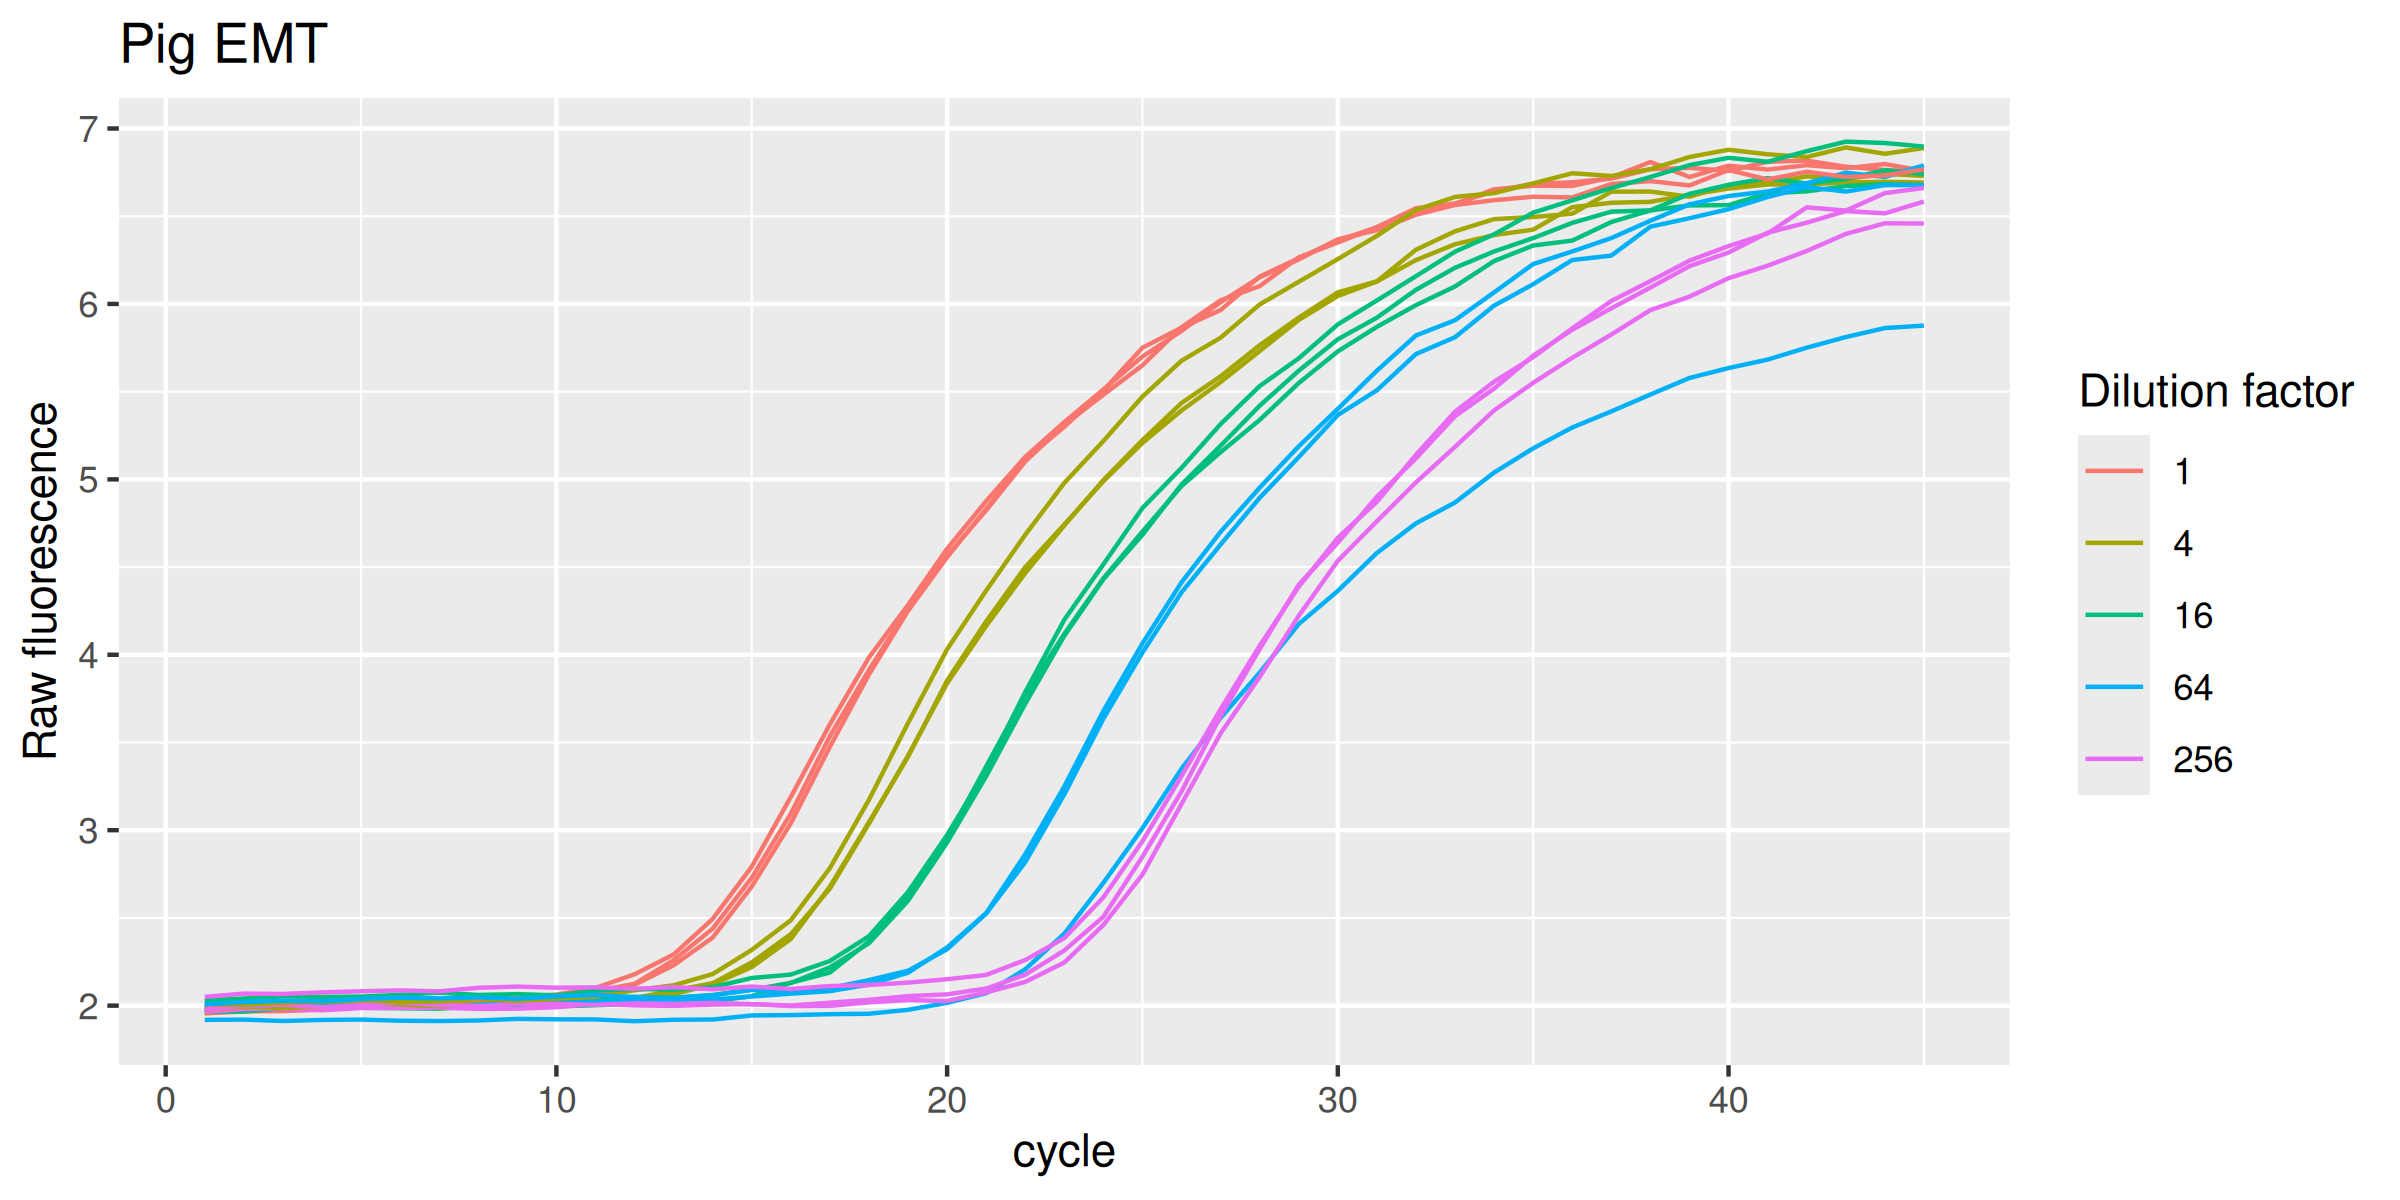
Chicken ETT
ETTch |>
  ggplot(mapping = aes(
    x = cycle,
    y = fluor,
    group = interaction(dilution, replicate),
    col = as.factor(dilution)
  )) +
  geom_line(linewidth = 0.5) +
  labs(y = "Raw fluorescence", colour = "Dilution factor", title = "Chicken ETT") +
  guides(color = guide_legend(override.aes = list(size = 0.5)))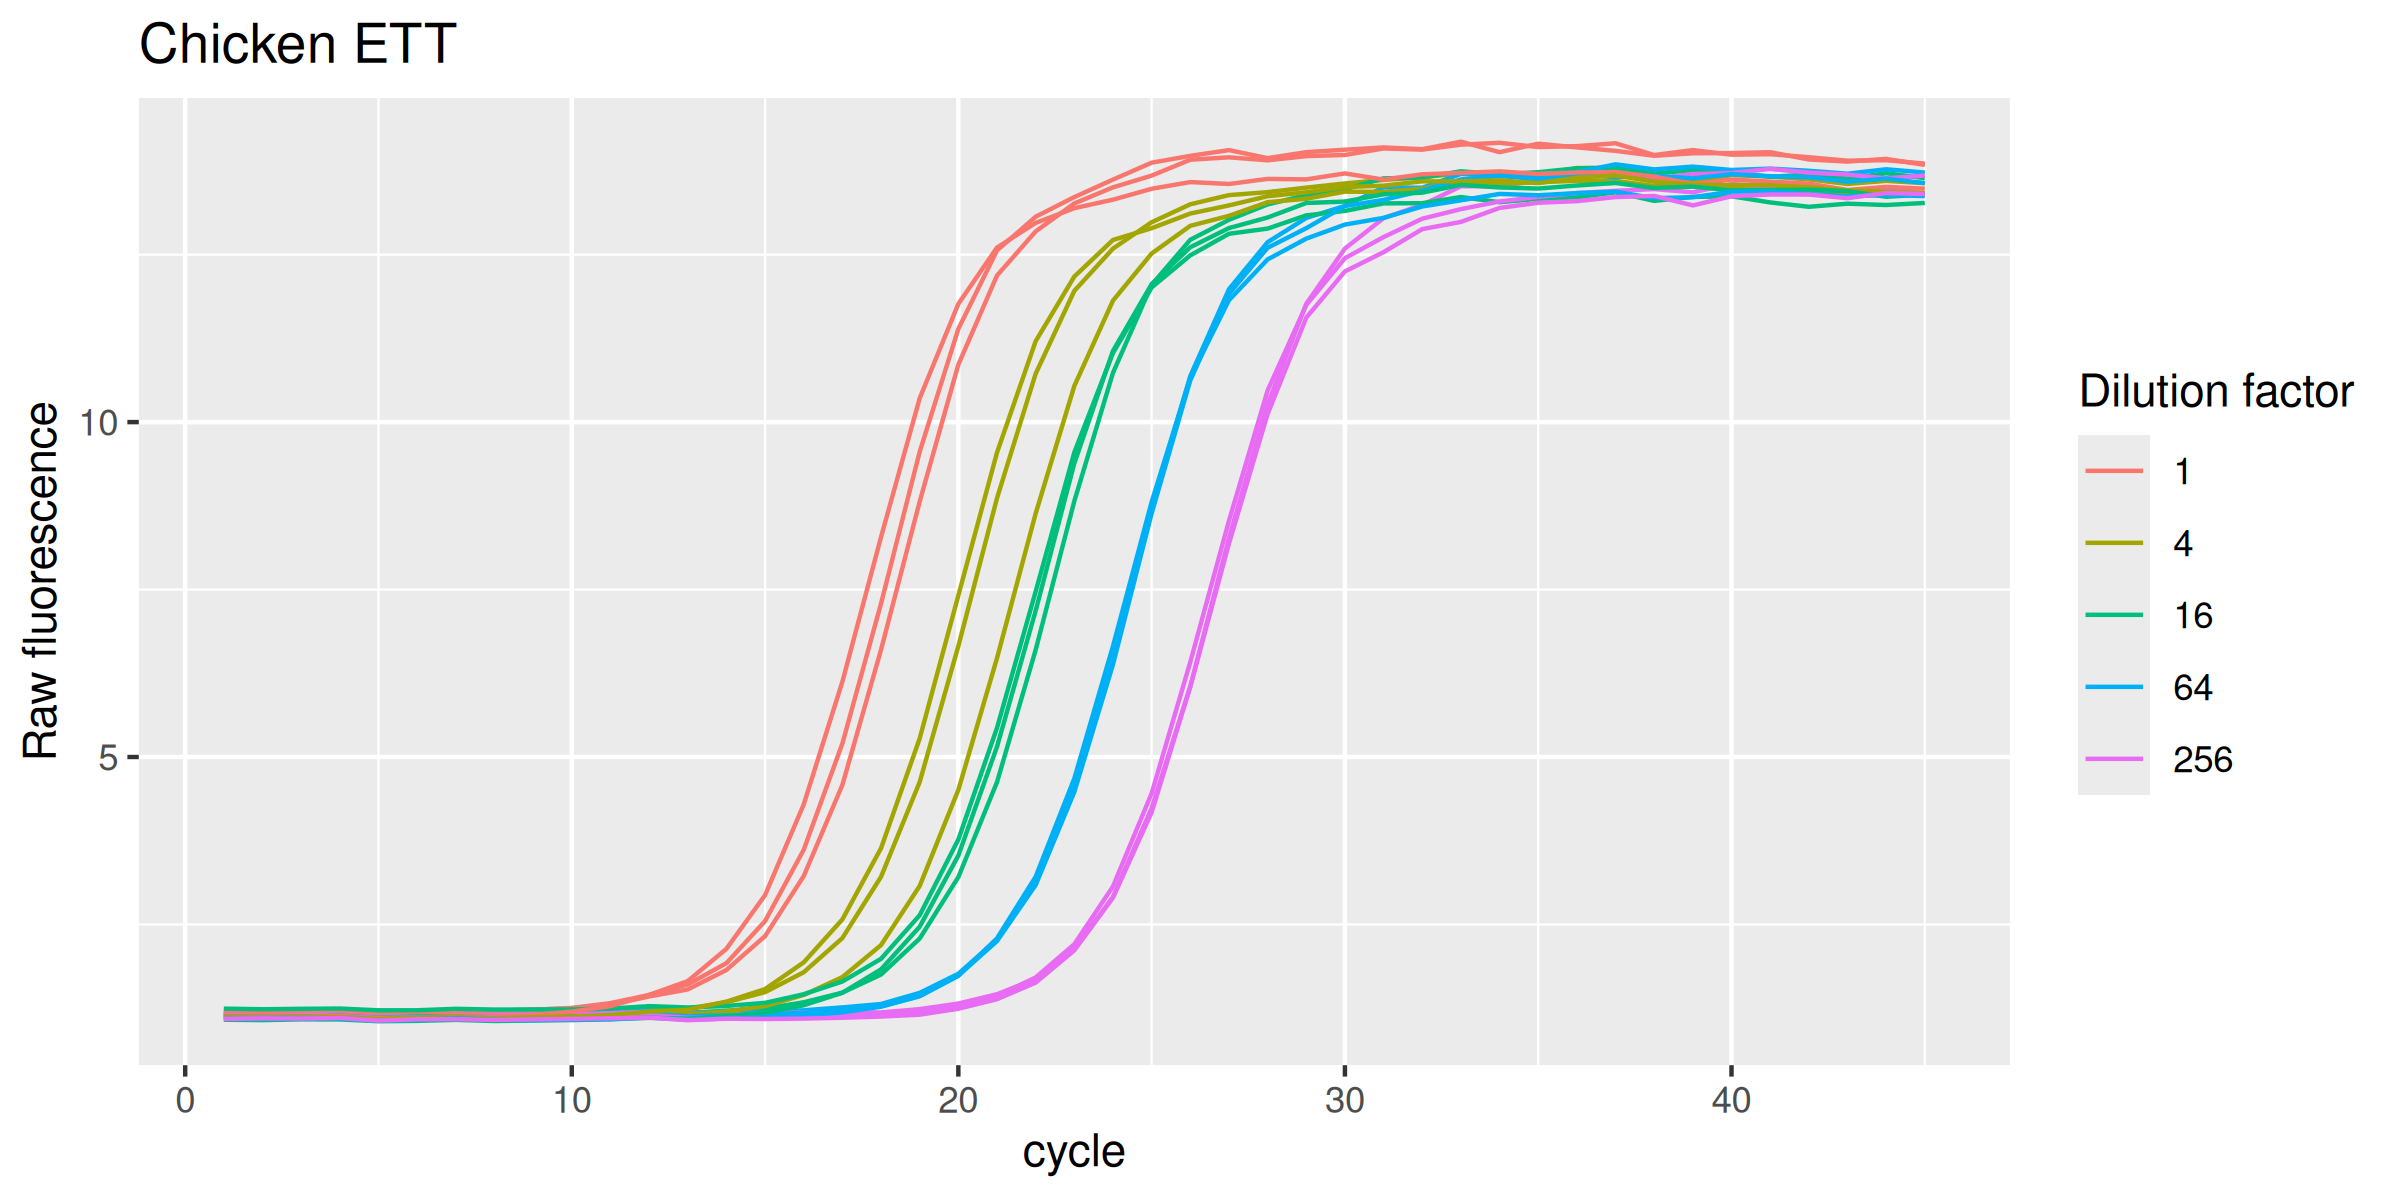
Human GAPDH
GAPDHh |>
  ggplot(mapping = aes(
    x = cycle,
    y = fluor,
    group = interaction(dilution, replicate),
    col = as.factor(dilution)
  )) +
  geom_line(linewidth = 0.5) +
  labs(y = "Raw fluorescence", colour = "Dilution factor", title = "Human GAPDH") +
  guides(color = guide_legend(override.aes = list(size = 0.5)))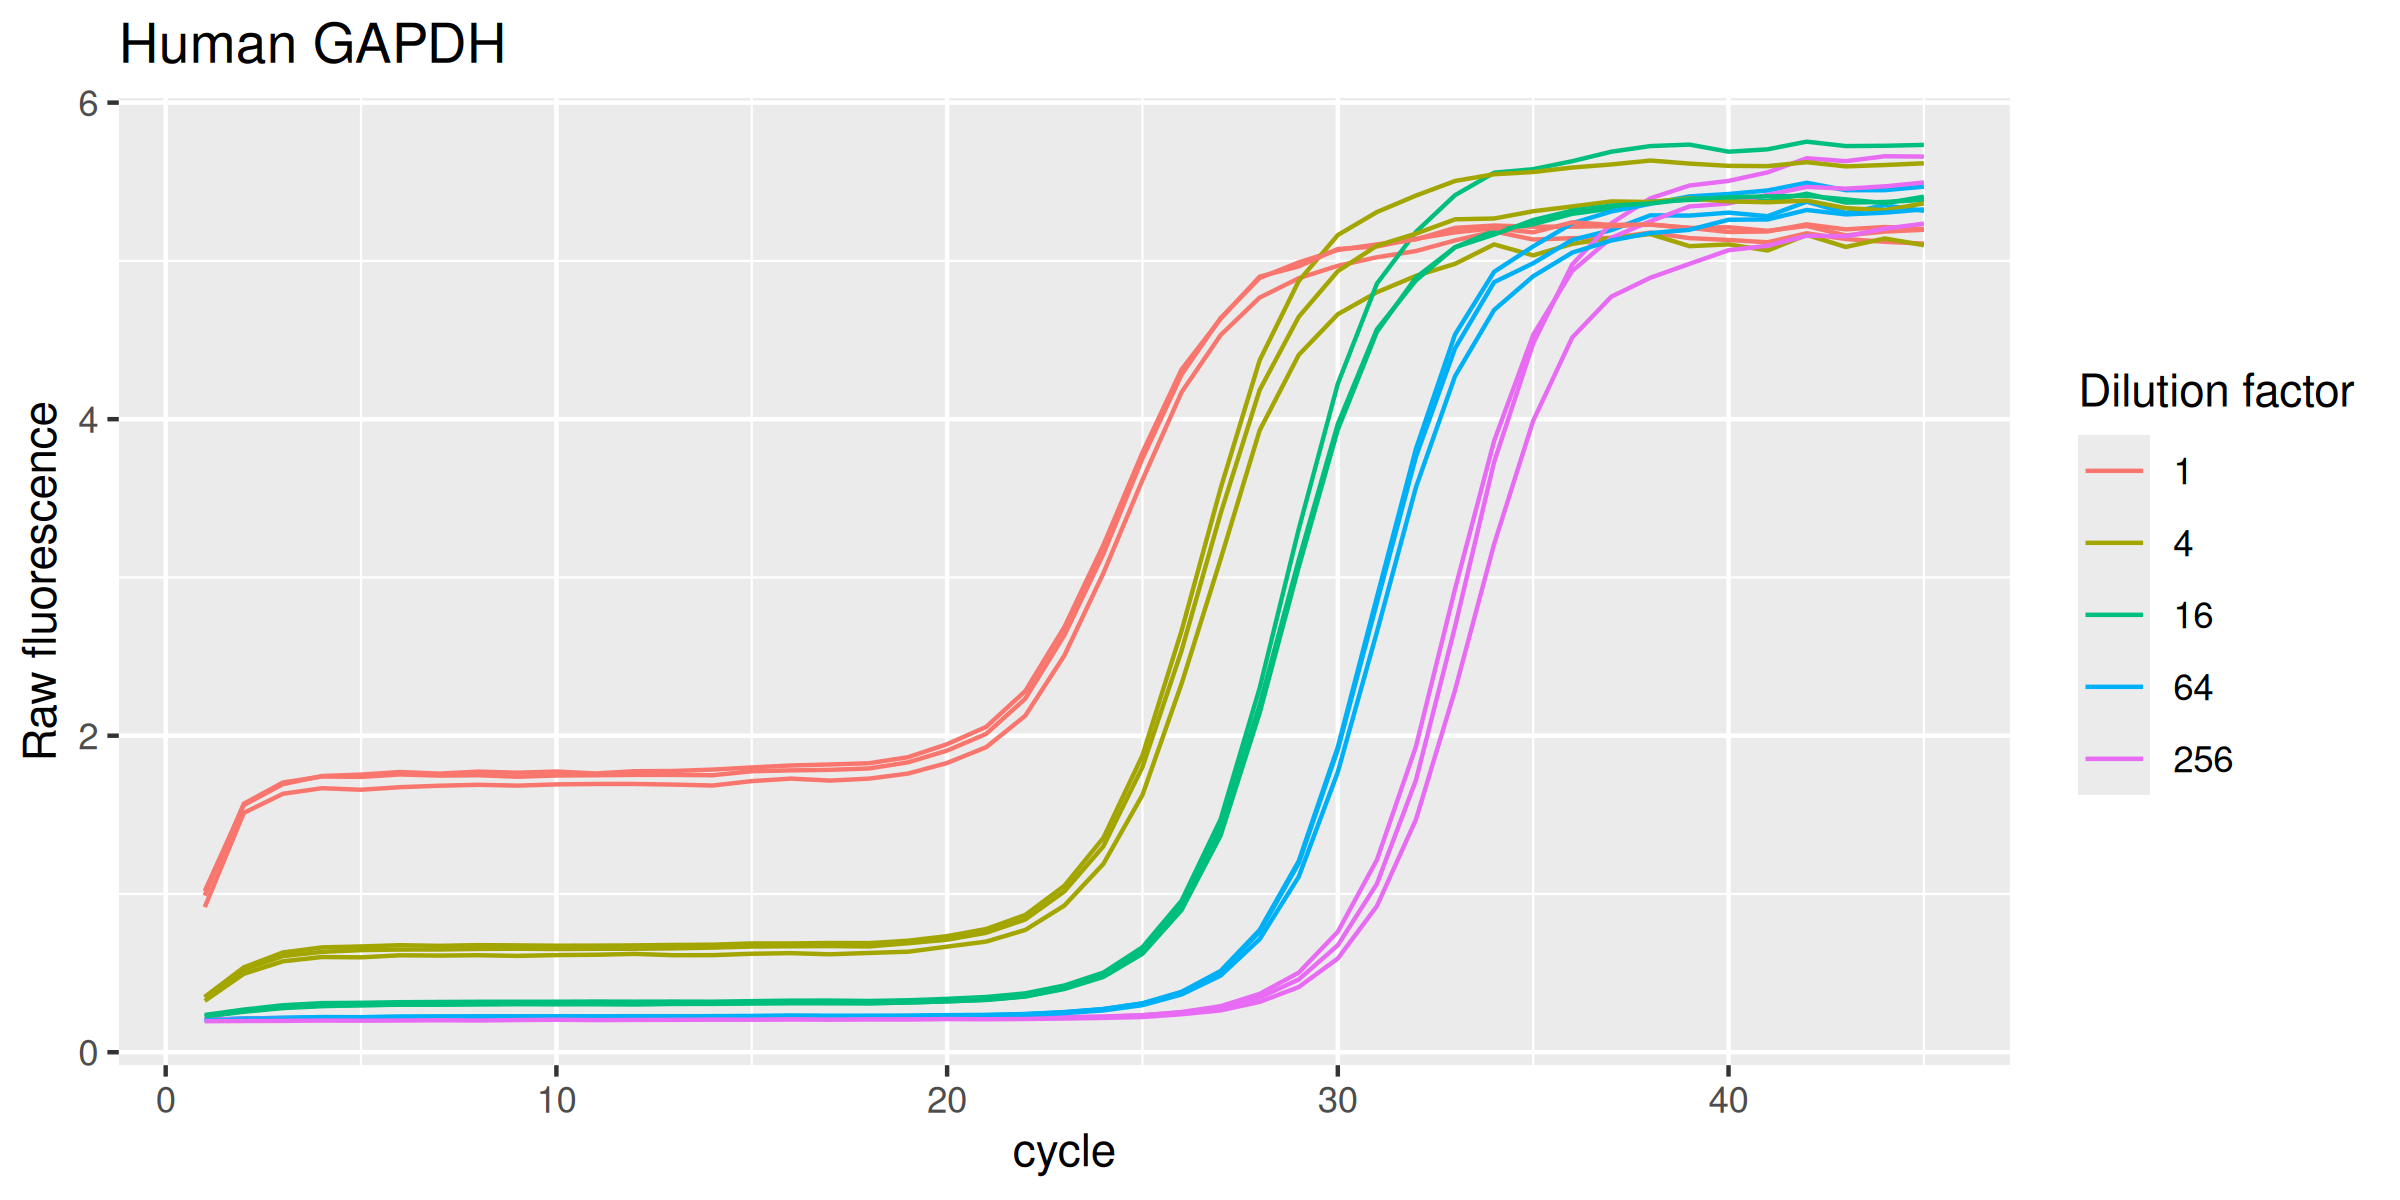
Code of Conduct
Please note that the batsch project is released with a Contributor Code of Conduct. By contributing to this project, you agree to abide by its terms.
References
- Anke Batsch, Andrea Noetel, Christian Fork, Anita Urban, Daliborka Lazic, Tina Lucas, Julia Pietsch, Andreas Lazar, Edgar Schömig & Dirk Gründemann. Simultaneous fitting of real-time PCR data with efficiency of amplification modeled as Gaussian function of target fluorescence. BMC Bioinformatics 9:95 (2008). doi: 10.1186/1471-2105-9-95.